- Optimize PostgreSQL performance with smarter design, not bigger servers.
- Fix slow queries, tune memory, and achieve lasting database speed.
PostgreSQL Performance Optimization: What Actually Matters
Published on: 13 January 2026
Last updated on: 16 June 2026
It’s Monday morning, and your team is reviewing weekend metrics. The dashboard hangs for a few seconds, then freezes. Reports that once loaded instantly now take half a minute. Someone says, “Let’s get a bigger server.”
That quick fix sounds tempting but rarely works.
Adding hardware only hides deeper issues like slow queries, bloated indexes, or poor caching. Even the most powerful machines struggle when the database isn’t tuned right.
In 2025, PostgreSQL performance optimization means smarter systems, not stronger servers.
Clean queries, balanced indexing, and thoughtful configuration lead to real speed, not just temporary relief.
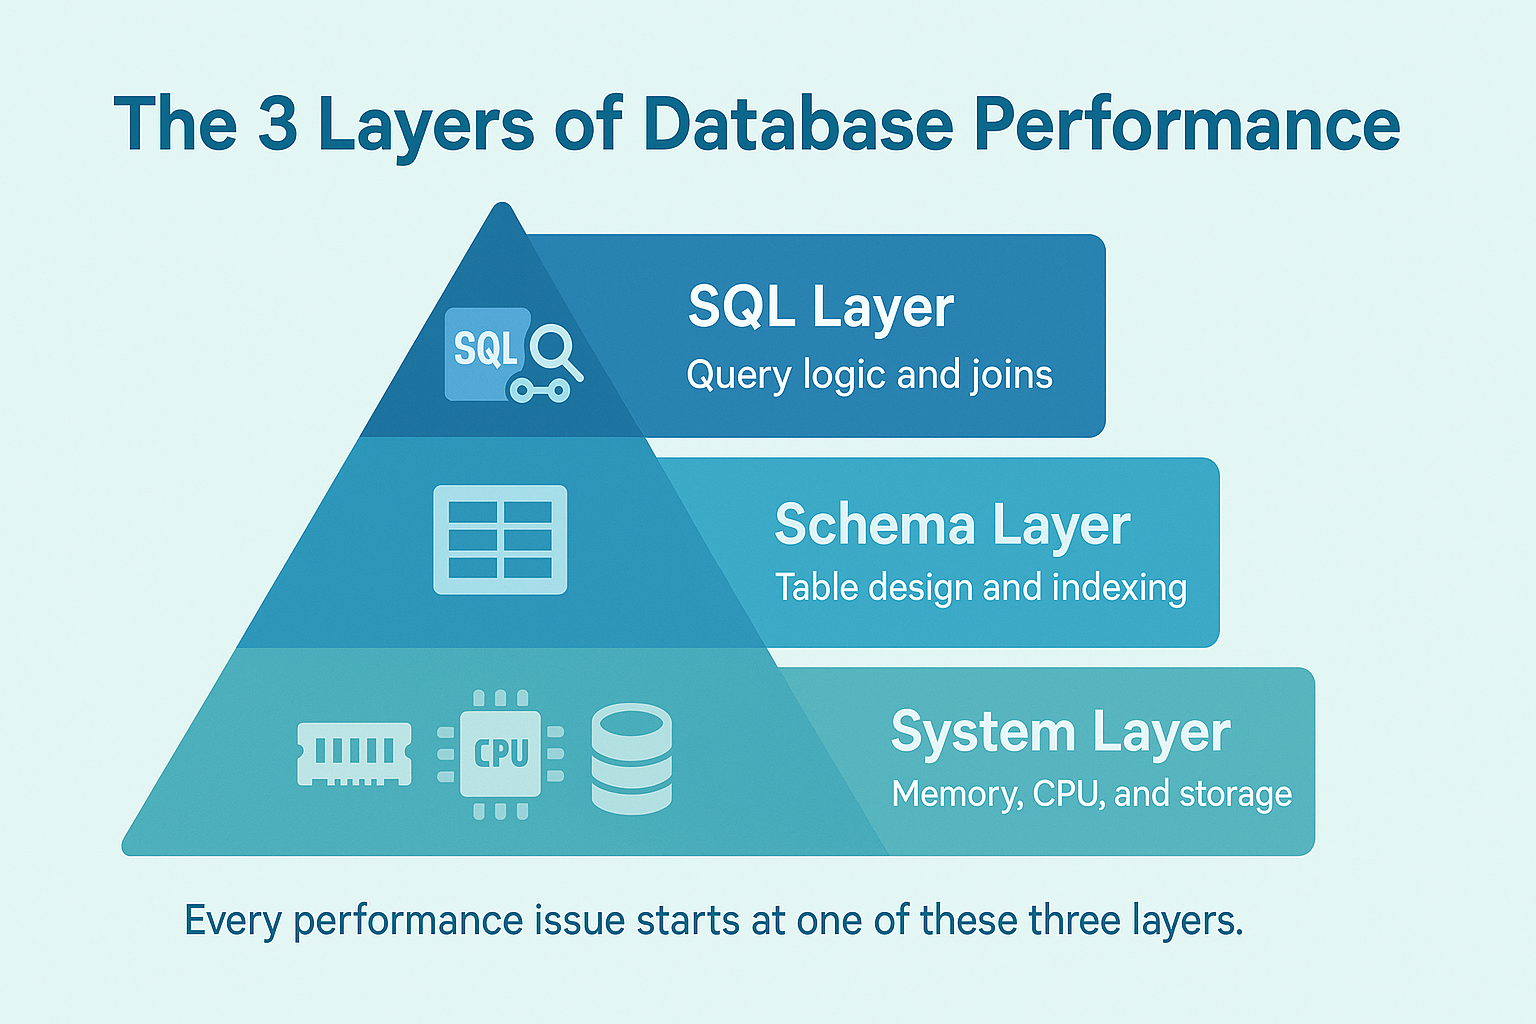
Why PostgreSQL Performance Drops (and How to Think About It)
PostgreSQL is powerful, but it is not magical. Performance bottlenecks usually come from three places:
- Inefficient queries – SQL patterns that force full table scans or unnecessary joins.
- Poor indexing strategy – either too many indexes that slow down writes, or too few that slow down reads.
- Misconfigured memory and connections – settings that are tuned for yesterday’s workload, not today’s.
Think of PostgreSQL like a three-layer engine:
- SQL layer: how queries are written and optimized.
- Schema layer: how data is organized and indexed.
- System layer: how memory, CPU, and disk I/O are managed.
If any layer is misaligned, performance will drop no matter how powerful your server is.
Always measure before tuning. Optimization without metrics is just guesswork.
Start Where It Matters: Query Optimization
The fastest improvements in PostgreSQL performance almost always start with the queries.
Step 1: Find the Culprits
Enable pg_stat_statements and check which queries have the highest total execution time. These are your slowest offenders.
Step 2: Visualize the Plan
Run:
EXPLAIN (ANALYZE, BUFFERS)
SELECT * FROM orders WHERE status = 'pending';
If you see Seq Scan on a large table, it means PostgreSQL is reading every row instead of using an index.
Step 3: Simplify the Logic
Avoid correlated subqueries that run once per row. Replace them with JOINs or Common Table Expressions (CTEs) when appropriate.
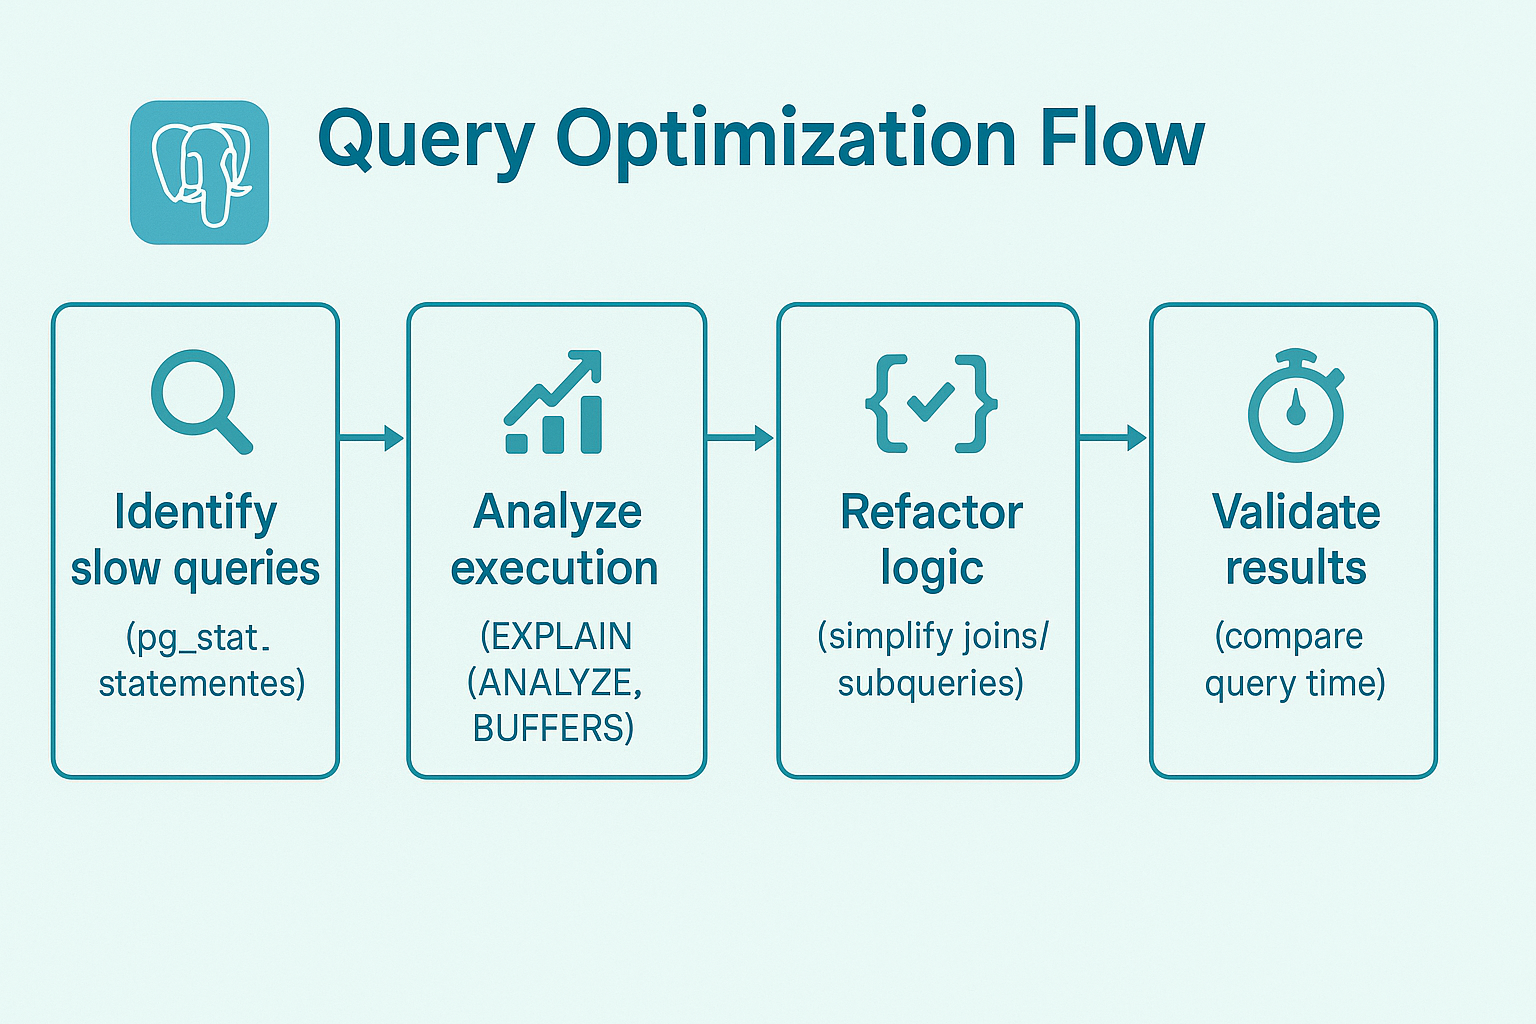
The easiest way to optimize PostgreSQL queries is to analyze slow query logs, find full table scans, and build indexes that match your most frequent filters and joins.
A single rewritten query can outperform any server upgrade and it costs nothing but insight.
Smarter Indexing: The 80/20 Rule of Database Speed
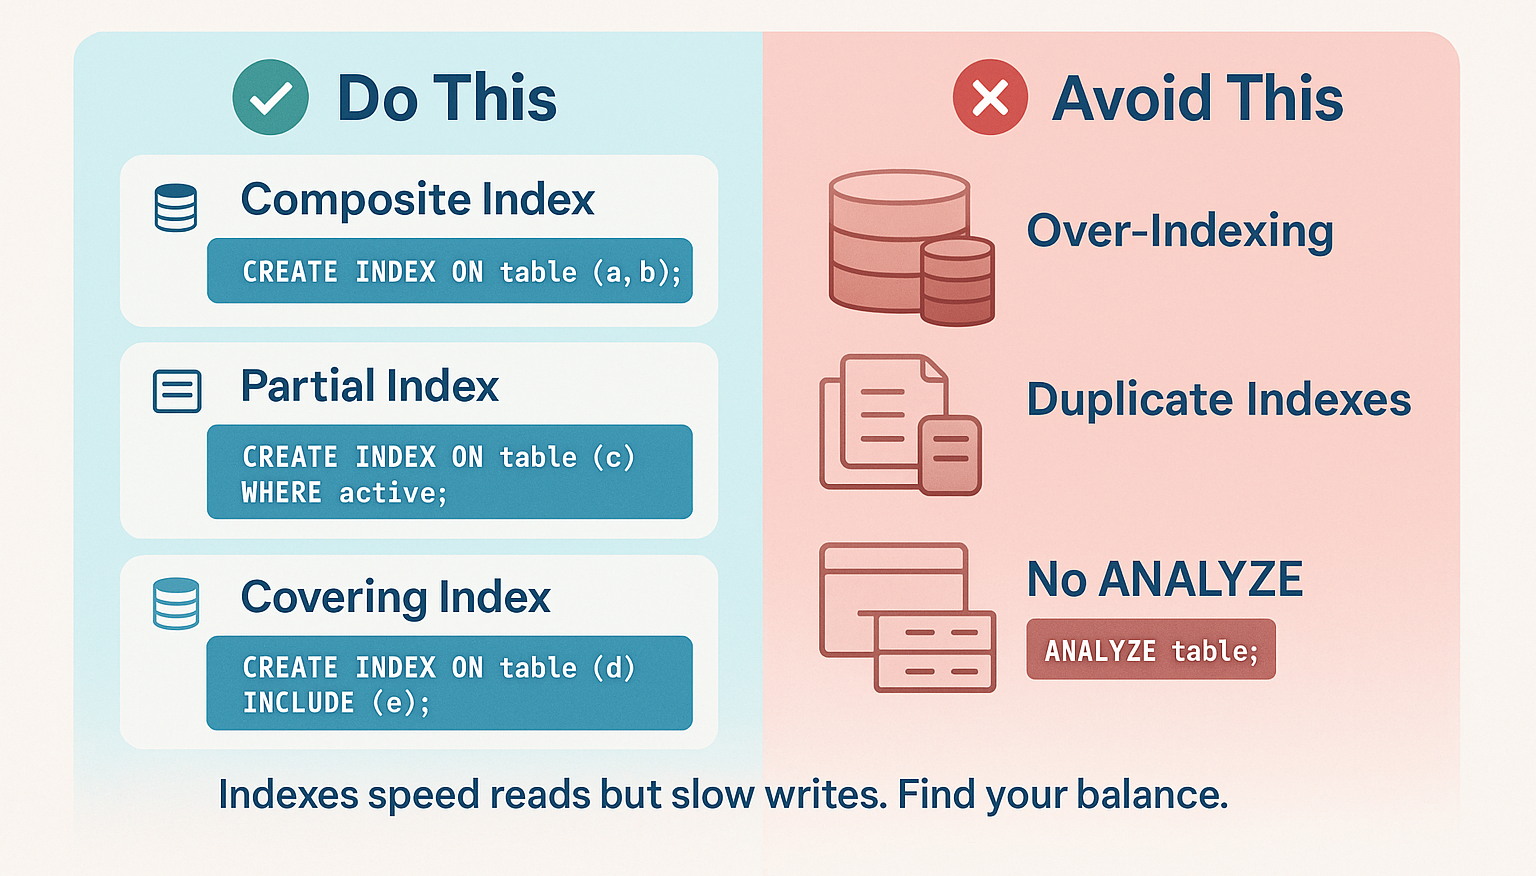
Three Index Types That Matter Most:
- Composite Indexes – Ideal for multi-column filters and sorting.
 CREATE INDEX idx_orders_status_date
ON orders (status, created_at);
- Partial Indexes – Efficient for filtering by boolean or status flags.
 CREATE INDEX idx_users_active
ON users (created_at) WHERE is_active = TRUE;
- Covering Indexes – Use INCLUDE to store columns in the index for index-only scans.
Index Maintenance Tips:
Run pg_stat_all_indexes to find unused indexes (idx_scan = 0).
Drop redundant ones with DROP INDEX CONCURRENTLY.
After adding or removing indexes, always run ANALYZE to refresh planner statistics.
Good indexing keeps both read and write operations predictable, which is the foundation of a high-performance PostgreSQL database.
Tune Memory the Right Way (Without Guessing)
Once your queries and indexes are optimized, it is time to tune PostgreSQL’s memory.
Key Settings That Actually Matter:
| Setting | Role | Recommended Range |
| shared_buffers | Primary cache for frequently accessed data and indexes. | 25–40% of total RAM. |
| work_mem | Memory per sort or hash operation. | 16–64 MB for most workloads. |
| Effective_cache_size | Planner hint for OS-level caching. | ~70–80% of total RAM. |
These three settings influence most memory-related performance outcomes.
Connection Pooling
PostgreSQL creates a process for each client connection, so increasing max_connections can quickly overload the server.
Use pgBouncer or Pgpool-II to maintain a small pool of active connections and route requests efficiently.
Connection pooling reduces RAM usage, improves response times, and prevents crashes during high traffic.
Parallelism and WAL Settings
Parallelism: Enable it carefully. It is great for analytics but not ideal for high-concurrency workloads.
Write-Ahead Logging (WAL): Adjust max_wal_size for write-heavy apps, but remember that larger WAL files can increase recovery time after failures.
Schema Design That Scales with You
Good performance begins with smart structure. A well-designed schema doesn’t just organize data, it determines how efficiently PostgreSQL performs as your system grows.
Focus on clarity and scalability.
Normalize your data where accuracy matters most, but denormalize in areas where read speed is critical. When tables start getting large, partition them by time, region, or usage patterns so queries target only the “hot” active data.
Think long-term. Archive old data instead of deleting it to preserve history without slowing your live database. Every design choice from relationships to indexes, should help PostgreSQL respond faster, not harder.
A thoughtful schema ensures your system stays consistent, predictable, and easy to scale as data volumes climb.
Observability: Optimize What You Can Measure
You can’t improve what you don’t monitor.
Observability is what separates proactive database teams from reactive ones.
Track a few key performance signals:
- Cache Hit Ratio — keep it near 99% to ensure queries use memory efficiently.
- Index Usage — find redundant or idle indexes before they waste resources.
- Query Duration — spot slow-running SQL before it hurts user experience.
- Connection Spikes — detect stress points in pooling or concurrent workloads.
Use modern tools like pgHero, pganalyze, Prometheus with Grafana, or OpenTelemetry to visualize this data. They make it easy to spot trends, catch anomalies, and correlate performance with real-world usage.
Strong observability turns your database from a black box into a measurable, predictable system, one that performs reliably, even under pressure.
The Mediusware Optimization Loop: A 3-Step Framework for Database Efficiency
Many teams ask, “Where should we start tuning PostgreSQL?”
Our answer is simple: follow the loop.
1. Fix the Code
Optimize queries and indexes first. Most bottlenecks live here.
2. Tune the Memory
Adjust buffers and connection pools after you have fixed the queries.
3. Refine the System
Tweak WAL, parallelism, and caching once the foundation is stable.
Measure → Adjust → Measure Again.
That is the discipline behind every fast, reliable PostgreSQL instance.
This is a simple, repeatable process that turns random tuning into a measurable strategy.
The Future of PostgreSQL Optimization (2025 and Beyond)
PostgreSQL is evolving rapidly, and the way we optimize it is changing too.
Emerging Trends to Watch:
- AI-assisted tuning: Tools like pgai analyze query plans and suggest improvements automatically.
- Self-learning caching: Machine learning models pre-load data before queries are executed.
- Serverless PostgreSQL: Platforms like Neon and Supabase scale compute based on demand.
- Smarter partitioning: PostgreSQL 17+ improves partition pruning, reducing query time for massive tables.
The next era of optimization focuses on intelligence and automation, not manual tweaking.
Keep It Simple, Keep It Fast
The best PostgreSQL setups aren’t complex, they’re consistent.
You don’t need dozens of configuration tweaks. You just need the right habits.
Write clean, predictable SQL.
Queries should express intent clearly, not complexity.
Index with purpose.
Create indexes that serve real queries, not “just in case” ones.
Tune memory based on data.
Let metrics guide your adjustments, not assumptions.
Monitor continuously.
Detects performance drifts before users notice them.
PostgreSQL performance optimization isn’t a one-time project, it’s an ongoing discipline. When you keep things simple, you make your system faster, easier to maintain, and far more reliable in the long run.
Want a faster, leaner PostgreSQL setup for your growing business?
At Mediusware, we help teams tune, monitor, and scale PostgreSQL databases with proven optimization frameworks built for real workloads.Let’s make your database faster, smarter, and ready for the future.

I work at the point where product decisions, system architecture, and engineering execution meet. At Mediusware, I’m accountable for how technology choices affect reliability, scale, and long-term delivery for our clients.
Featureblogs
Relatedblogs
01
Top 10 Programming Languages to Use in 202402
Looking Ahead: Top 10 Software Development Trends for 202403
Top 20 Best Software Companies in Bangladesh (2024)04
7 Ways to Ensure Data Security When Outsourcing Software Development05
How to Create a Stunning WordPress Website in 2024: Step-by-Step TutorialAuthorblogs
01
How Digital Agencies Can Deliver Custom Software Without Hiring Developers02
AI in FinTech: Build, Buy, or Integrate? A Founder's Decision Framework03
The Real Reason SaaS MVPs Miss Launch Deadlines04
How Seed-Stage SaaS Teams Add Engineering Capacity Without Hiring Chaos05
Why Seed-Stage SaaS Startups Struggle to Ship Fast