-
Power BI ensures consistency; Tableau enables exploration, depending on your data strategy.
- Analytics success depends on operating model, not tools: structure, ownership, and trust matter most.
Power BI vs Tableau: The Enterprise Analytics Decision Framework
1 min read
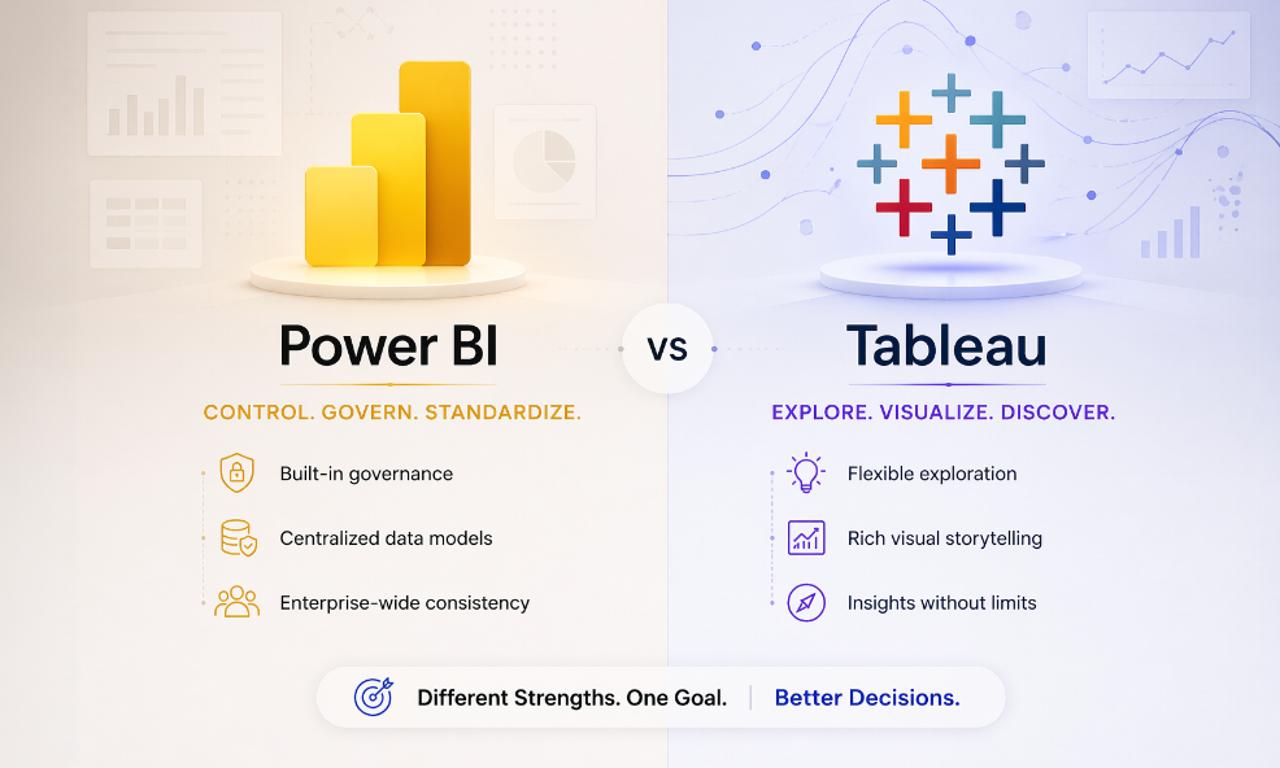
Most companies don’t lose at analytics because of bad tools.
They lose because their dashboards stop being trusted.
You’ve probably seen it.
Two reports. Same metric. Different numbers.
Suddenly, leadership stops making decisions and starts arguing.
That’s not a tool problem.
That’s a data authority problem.
So if you’re comparing Power BI vs Tableau, you’re not picking a dashboard tool.
You’re deciding:
- Who owns the truth
- How decisions get made
- Whether your data scales or breaks
Let’s break this the way enterprises actually operate.
Why This Decision Becomes Expensive Later
Most comparisons focus on UI or pricing.
That’s the easy part.
The real problems show up after scale:
- Multiple teams publishing dashboards
- KPI definitions drifting
- Costs creeping silently
- Self-service turning into self-conflict
As Gartner puts it:
Poor data governance remains one of the top barriers to business value from analytics.
That’s where Power BI and Tableau behave very differently.
Power BI vs Tableau: Core Differences
| Aspect | Power BI | Tableau |
| Philosophy | Control & standardization | Exploration & flexibility |
| Strength | Governance, consistency | Visualization, storytelling |
| Best Fit | Microsoft-first enterprises | Multi-cloud environments |
| Risk | Slower experimentation | Metric inconsistency |
Neither is “better.”
One aligns better with your operating model.
Governance: Where Analytics Actually Succeeds
Most teams think dashboards come first.
They don’t.
Governance comes first.
Power BI (Control First)
Power BI is built around Microsoft’s ecosystem.
If you already use Azure / Microsoft 365:
- Identity control via Entra ID
- Row-level & column-level security
- Centralized workspace permissions
Result: Consistency is enforced by design.
Tableau (Freedom First)
Tableau gives you flexibility.
But flexibility comes with responsibility.
You need:
- Defined data ownership
- Governance policies
- Active review cycles
Result: Governance depends on team maturity.
What This Really Means
- Power BI → governance is built-in
- Tableau → governance is self-managed
If your team isn’t disciplined, Tableau will expose that fast.
The Real Problem: Metric Drift
This is where most analytics systems quietly fail.
“Revenue” should mean one thing.
In reality, it often means five.
Power BI Approach
- Central semantic models
- Reusable datasets
- Certified data layers
Strong for consistency at scale.
Tableau Approach
- Flexible relationships
- Fast exploration
- Independent datasets
Strong for discovery
But here’s the trade-off:
More flexibility = more chances for inconsistency.
Rule of Thumb
- Need one source of truth → Power BI
- Need fast insights & exploration → Tableau
DevOps & Analytics Engineering
Modern analytics isn’t just dashboards.
It’s infrastructure.
Power BI
- Git integration
- CI/CD friendly
- Works naturally with Azure DevOps
Faster for engineering-led teams.
Tableau
- Strong APIs
- Flexible deployment
- Requires manual DevOps setup
More flexible, but more effort
Collaboration: Who Actually Uses the Dashboards?
Dashboards are useless if nobody uses them.
Power BI
- Native to Teams & SharePoint
- Easy internal distribution
- Ideal for operational reporting
Tableau
- Strong embedded analytics
- Better storytelling
- Works well for external sharing
Cost: The Slow Problem Nobody Tracks
BI costs don’t explode.
They slowly bleed.
Power BI
- Lower entry cost
- Premium needed at scale
- Risk of over-provisioning
Tableau
- Higher per-user pricing
- More predictable licensing
- Infrastructure cost if self-hosted
What Actually Matters
Track:
- Dashboard usage
- Active users
- Refresh frequency
- Cost per insight
If no one uses a dashboard → it’s wasted budget.
When Companies Use Both And When It Fails
Many enterprises use both tools.
Typical pattern:
- Power BI → standardized reporting
- Tableau → exploration & storytelling
This works only if:
- Shared semantic layer exists
- Governance is centralized
- Tool boundaries are clear
Otherwise:
- Duplicate dashboards
- Conflicting metrics
- Loss of trust
The Real Decision That Most Teams Skip
The tool is not the decision.
The operating model is.
A healthy analytics system includes:
- Central data engineering team
- Certified datasets
- Clear metric ownership
- Review cycles
- Training for teams
We’ve seen this pattern across multiple platforms like Quiri, where structured data models and centralized dashboards significantly improved decision-making accuracy and reduced confusion across teams.
How to Actually Choose
Ask these questions:
- Are we Microsoft-first or platform-agnostic?
- Do we value consistency or exploration more?
- Do we have strong governance discipline?
- Who owns metric definitions?
- How mature is our data culture?
Your answers will make the choice obvious.
Frequently Asked Questions
No. Tableau is better for flexibility. Power BI is better for control and consistency.

I work at the point where product decisions, system architecture, and engineering execution meet. At Mediusware, I’m accountable for how technology choices affect reliability, scale, and long-term delivery for our clients.
Featureblogs
Relatedblogs
01
How to Create a Stunning WordPress Website in 2024: Step-by-Step Tutorial02
How Mediusware Empowered Protesters, Strengthened the Economy & Showcased Employee Resilience in the 2024 Movement03
Mastering Error Handling in Rust with Essential Techniques04
Best Practices for Writing Clean Code05
Let's Deep Dive Into Threads with RustAuthorblogs
01
How Digital Agencies Can Deliver Custom Software Without Hiring Developers02
AI in FinTech: Build, Buy, or Integrate? A Founder's Decision Framework03
How to Choose a SaaS MVP Development Company04
How Seed-Stage SaaS Teams Add Engineering Capacity Without Hiring Chaos05
Why Seed-Stage SaaS Startups Struggle to Ship Fast